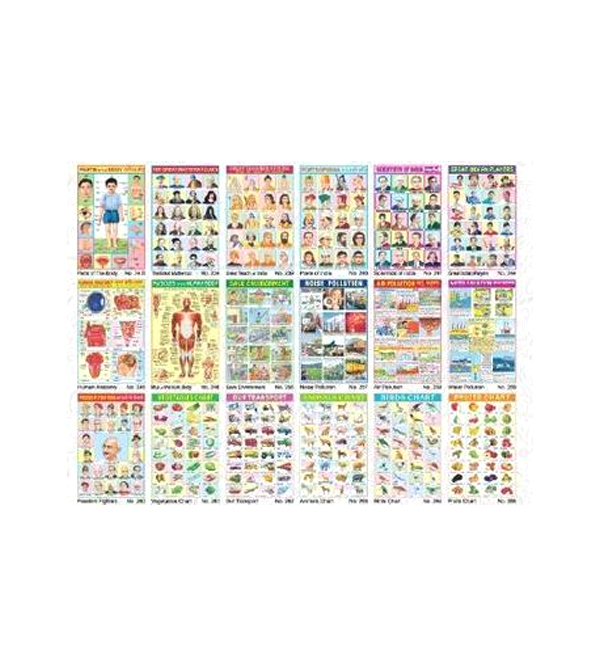
A chart is a symbolic representation of data or information according to some visualization technique. The information in a chart is represented graphically, it is also known as a graph. Educational Charts are often used to ease understanding of large quantities of data because human are generally able to understand meaning from pictures quicker than from text.
In educational department charts are used in biological labs as well as pharmacy, chemistry, physical and mathematical labs. The offered products are having a smooth finish, detailed prints & images and soft texture.


